


















Budget vs Actual Analysis: Why Finance Teams Need Flexed Budgets
Budget vs actual analysis: a flexed budget. Image: 2Fin (ai2fin.com).
Budget vs actual analysis is the systematic comparison of realized financial outcomes against planned targets, and its value lies in turning gaps into decisions. Learn the percentage and dollar variance formulas, use a flexed budget to separate volume effects from performance, and your forecasts and cost control sharpen. 2Fin automates the repetitive parts so reviews run faster.
Last reviewed October 2026. General information, not tax or financial advice.
TL;DR
- Calculate dollar variance as actual minus budget, then divide that difference by budget for percentage variance; interpret the sign differently for revenue and costs.
- For variable costs, compare actual spending with a flexed budget based on actual activity; this separates volume changes from price or efficiency problems.
- A low cost can look favorable while signaling stalled work, so pair financial variances with nonfinancial measures such as defect rates, headcount, or customer counts.
- Review results monthly, investigate material or recurring gaps, and assign each significant variance an owner, deadline, and a metric to check next cycle.
What budget vs actual analysis is and when to use it
At its core, this analysis lines up what you planned against what happened, then asks why the two differ. The primary objective is not to grade anyone. As the CFI team puts it, the purpose of variance analysis is to generate actionable insights for decision-making, and a common error is treating the budget as an immutable contract.
Most teams run it on a few predictable rhythms:
- Monthly close: the default cadence, catching drift while it is still fixable.
- Quarterly and year to date: shows whether monthly noise is a real trend.
- Post-project: compares a project's planned cost and timeline with what it actually consumed.
- Event-driven: triggered by a price shock, a lost customer, or a large unplanned purchase.
Direction matters when you interpret a gap. A favorable variance helps profit: revenue above plan, or costs below it. An unfavorable variance hurts it: say, shipping costs that run higher than budgeted. Investopedia notes that variances can stem from errors, changing conditions, or unmet expectations, so a favorable number is not automatically good news. Costs that come in low because a project stalled are favorable on paper and a problem in practice.
Treat the budget as a tool, not a verdict. When activity changes, flex it. When conditions shift for good, refresh the outlook with a rolling forecast, a method ICAEW describes as a way to keep expectations current and reduce the risk of an outdated budget. The forward-looking half is easy to try: the Cash Flow Forecast shows your next 90 days of cash, the lowest point and a what-if test.
How to calculate dollar variance, percentage variance, and a flexed budget
Two formulas do most of the work. Both appear in IBM's variance analysis overview, and you can reproduce them in any spreadsheet.
- Dollar (absolute) variance = Actual − Budgeted. For example, if actual marketing spend exceeds the budget, the variance is unfavorable for an expense.
- Percentage variance = (Actual − Budgeted) / Budgeted. Divide the dollar variance by the budgeted amount. Read the sign against the line type: positive on revenue is favorable, positive on cost is unfavorable.
- Flexed budget = budgeted cost per unit of activity × actual activity. Multiply the budgeted variable cost per unit by actual activity to find the flexed budget. Compare actual variable costs with that amount to identify the overspend, rather than comparing them with a static budget.
Static budgets can mislead: ACCA's budgeting guidance explains that a flexed budget recalculates expectations at actual activity levels, giving a more accurate benchmark than a static budget.
The reason this works is separation. Comparing actuals to a static budget blends volume effects with performance effects. Comparing to the flexed budget isolates what activity explains and leaves the remainder for operations to answer for.
Types of variances and what usually causes them
Total variance is rarely one story. Splitting it into categories tells you who should act. ACCA's practitioner method breaks it into planning and operational pieces, and the categories below follow that logic.
- Volume variance: the cost or revenue change caused by selling or producing more or fewer units than planned. Flexing the budget removes it.
- Price or rate variance: you paid more or less per unit than planned, such as a supplier increase or a wage rate change.
- Efficiency or quantity variance: you used more or fewer inputs than the standard, such as extra material waste or overtime hours.
- Planning variance: the original budget was unrealistic for the conditions, for example a cost assumption that was already stale on day one.
Causes also differ in controllability. Operational causes, like scrap, rework, or poor scheduling, sit inside the business. External causes, like currency moves, commodity prices, or a new regulation, mostly do not, though they may call for a revised forecast.
Not every gap deserves a meeting. Set a materiality rule, say a variance above a chosen dollar amount or percentage, and also watch frequency. A small variance that repeats over time is often more informative than a one-off spike.
Pro Tip: Tag each material variance as controllable or uncontrollable before the review meeting. It keeps discussion on actions rather than excuses.
Related reading: zero-based budgeting, envelope budgeting, burn rate and cost of goods sold are the terms that come up most when a variance needs explaining. For irregular income, budgeting on an irregular income shows how to flex a plan that never has two identical months.
A step-by-step method that leads to decisions
Run these steps in the same order every month so results stay comparable and the work gets faster.
- Collect and reconcile actuals. Pull bank feeds, general ledger balances, and transaction categories, then reconcile them. Variances built on unreconciled data are noise.
- Confirm the budget basis. Check which version you are comparing against and split each line into fixed and variable components, since only variable items flex.
- Flex the budget and compute variances. Recalculate the variable lines at actual activity, then compute dollar and percentage variances against both the static and flexed budgets.
- Decompose the variances. Separate price from quantity, or mix from rate, so each variance points to an owner and an action.
- Apply materiality and prioritize. Rank what remains by size and persistence, and send the top items for investigation.
- Document the narrative and actions. Write what happened, why, and what you will do about it.
For step 5, prepare a standard set of investigative questions:
- Is the driver one-off or recurring?
- Did volume, price, or usage move?
- Was the budget assumption wrong from the start?
- Does this change the full-year outlook?
- Who owns the fix, and by when?
A caution on step 6: managers sometimes shape budget assumptions so operational variances look favorable. An ACCA specimen solution points out that pairing financial variance reports with nonfinancial KPIs helps expose masked inefficiencies. Keep that in mind when you write the narrative.
Fin tip: step 1 is the one that eats the month. In 2Fin the upload is the reconciliation: statements and bank feeds arrive categorized, anything unsure waits in one review list, and the totals for step 3 are already there. Try it on a real month.
Reporting and communicating variances to stakeholders
A variance report succeeds when a busy reader can quickly grasp the point. Put the headline items on the first page: the key variances, a one-line implication for each, and the recommended action. Detail belongs behind that page, not in front of it.
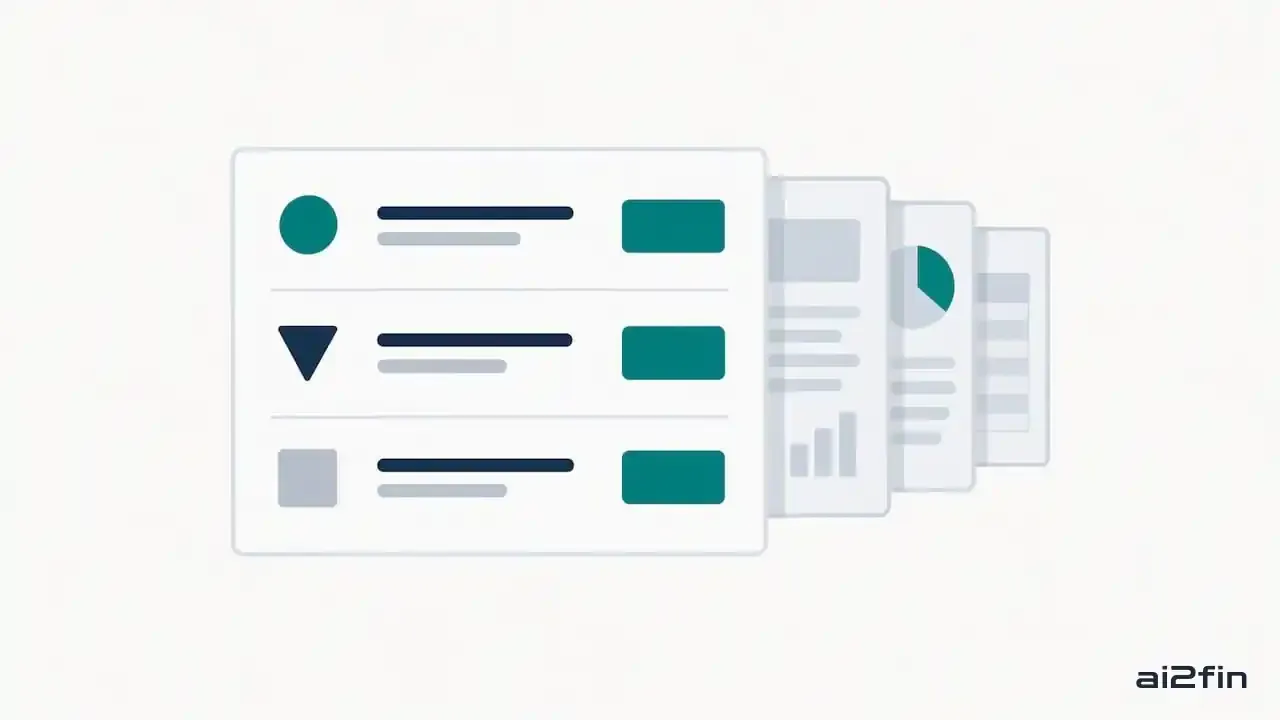
A variance report that leads with the summary. Image: 2Fin (ai2fin.com).
Explain movements, do not just list them. The IFRS management commentary materials recommend bridge analysis and reconciliations to explain significant variances and what they mean for future performance. A bridge walks from budgeted profit to actual profit one driver at a time: volume, price, efficiency, one-offs. Where currencies or acquisitions distort the picture, add a constant-currency or pro forma view so readers compare like with like.
Tailor depth to the audience:
- CFO: trend and forecast impact, meaning whether the full-year number moves.
- Operations leaders: root cause and what they can control.
- Board: strategic implication, kept to the few variances that change direction.
Then close the loop. Every material variance needs an owner, a deadline, and a follow-up metric, reviewed at the next cycle. Without that, the report becomes a record of problems rather than a tool for fixing them.
Pro Tip: Open the report with the single variance that most changes your forecast. Readers remember the first item and skim the rest.
Tools, templates, and example workflows
You do not need elaborate software to start. A clean spreadsheet template does the job if the structure is disciplined.
- Tabs: budget, actuals, flexed budget, and a variance summary.
- Columns: budget, actual, flexed budget, dollar variance, percentage variance, notes, and owner.
- Versioning: save a dated copy each month and keep year-to-date and monthly views on separate tabs so they never overwrite each other.
- Storage: keep the master template in a shared drive with edit rights limited to the preparer and a reviewer.
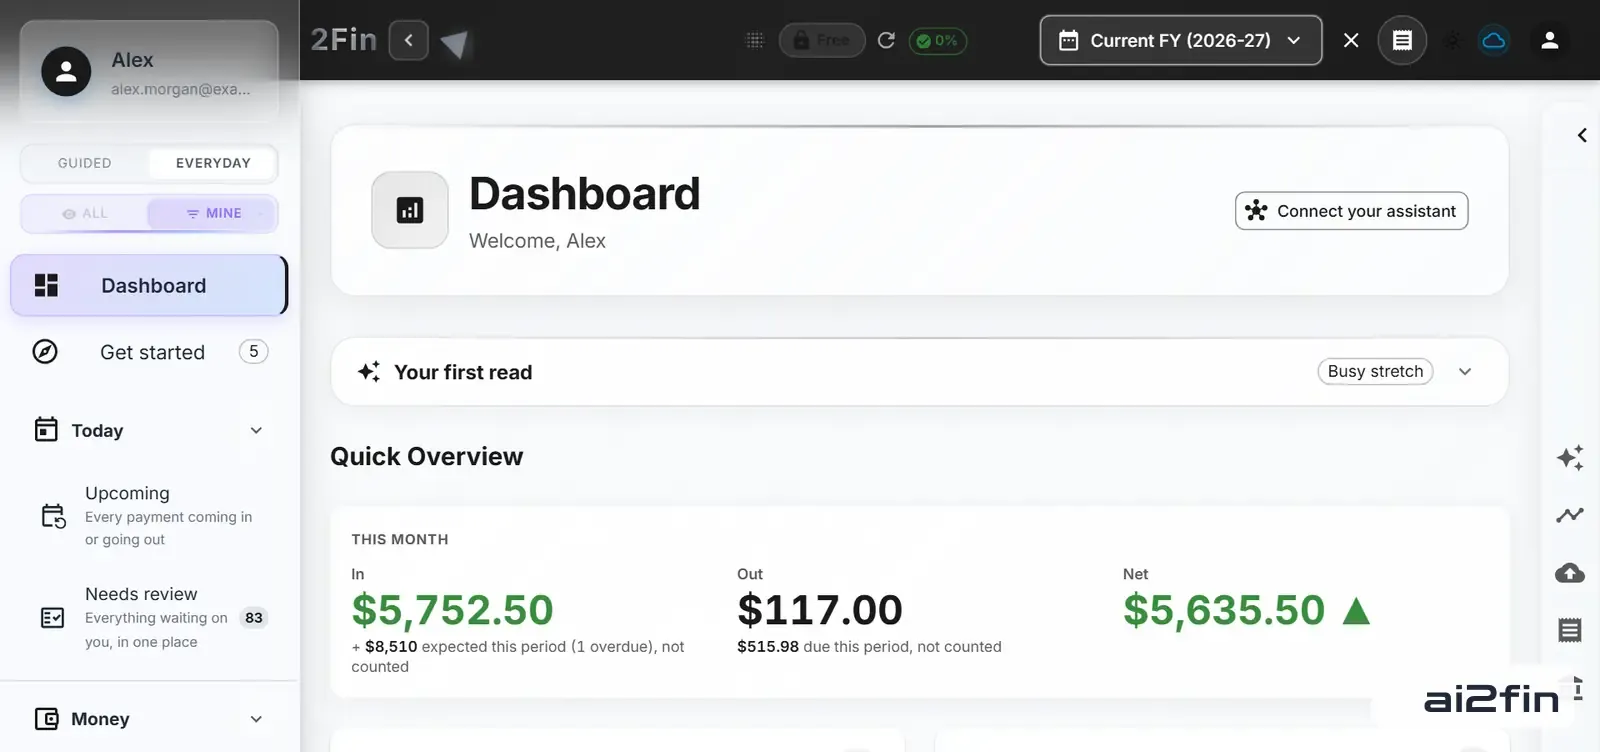
2Fin dashboard. Image: 2Fin (ai2fin.com).
The slowest part is usually reconciliation, not analysis. Bank and ledger imports with automated categorization cut that time sharply, because transactions arrive already sorted into the lines your template expects. The interactive money views and proactive budget allocations show how the same data can support budgeting, and why your budget stops working makes the case for refreshing a budget continuously instead of once a year.
A static budget is a starting hypothesis
A static annual budget is a starting hypothesis, not a scorecard. Flex it when activity changes and refresh the outlook as conditions move, so the conversation is about what to do next rather than who missed plan. Read financial variances next to nonfinancial measures such as defect rates, headcount or customer counts, which keep a favorable number from hiding a problem. Fin takes the mechanical work of bookkeeping and budgeting off the table so the time goes to interpretation.
Faster budget vs actual reviews with 2Fin
- Bank imports that keep actuals current
- Automated categorization that maps transactions to budget lines
- Budget allocations
- Exportable data for variance reports in Google Sheets, Excel or Notion
See how the flow works from bank import to tax-ready books. Related guides: bank reconciliation automation, automated bookkeeping for small businesses and where does my money go.
